A Practical Guide to Trendlines in Forex
This article explains how to draw trendlines in forex trading and use them to identify market trends, bounces, and breakouts. By understanding trendlines, traders can better read market direction and improve their trading decisions.
In forex trading, a trend refers to the general direction of price movement. Broadly speaking, there are three types of trends: bullish (uptrend), bearish (downtrend), and sideways, where prices move up and down within a limited range. In reality, however, price does not move in a straight line. Instead, it fluctuates in a zigzag pattern, moving up and down over time. For this reason, traders use trendlines to identify the prevailing trend in the market.
When drawn correctly, trendlines in forex can provide signals that are just as reliable as those generated by technical indicators. Even traders who focus on fundamental analysis can use trendlines to understand long-term price direction. Therefore, knowing how to draw trendlines properly is a skill that every trader should master.
Step 1: Identify Support and Resistance
To draw a trendline, you first need to identify the highest (High) and lowest (Low) price levels on the chart, which also function as resistance and support. For example, as shown on the EUR/USD chart below.
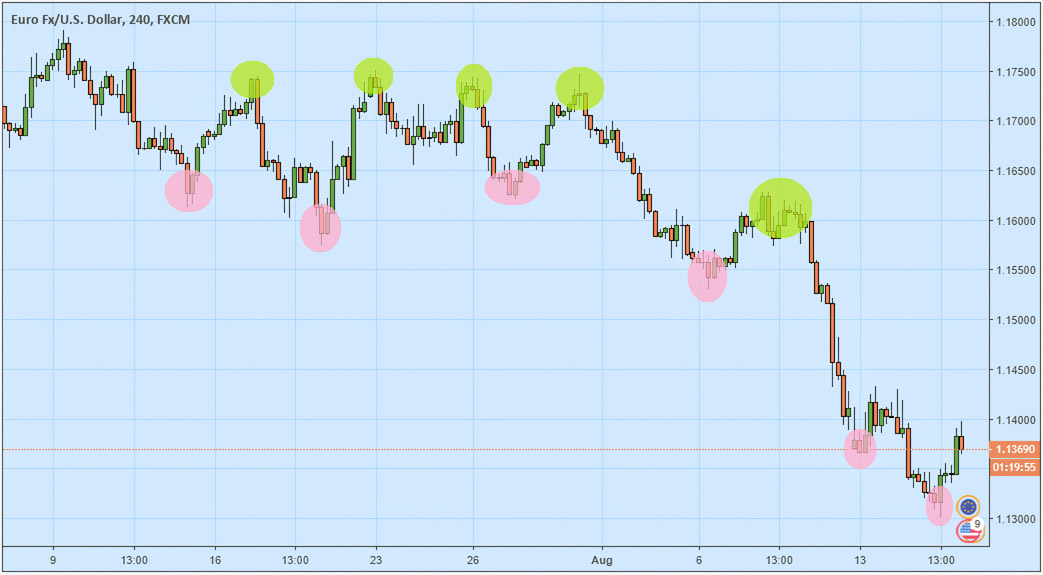
The peaks marked in green represent resistance, while the valleys marked in light red represent support. These points will serve as the reference levels for drawing trendlines.
Step 2: Draw Trendlines from Support and Resistance
Once support and resistance have been identified, the next step is to draw the trendlines. Most forex trading platforms, such as MetaTrader, provide built-in tools for drawing trendlines. When drawing them, follow these guidelines:
- Upper trendline: Draw a line connecting one resistance point to the next resistance point. At least two resistance points are required to form a valid trendline. The more resistance points that align with the line, the stronger and more reliable the trendline becomes.
- Lower trendline: Draw a line connecting one support point to the next support point. At least two support points are required to form a valid trendline. As with resistance, the more support points that align with the trendline, the stronger it is considered.
- Do not force a trendline to fit your expectations or preferred market bias. If a clear trendline is difficult to draw, it may indicate that the market is currently uncertain or moving in a choppy manner.
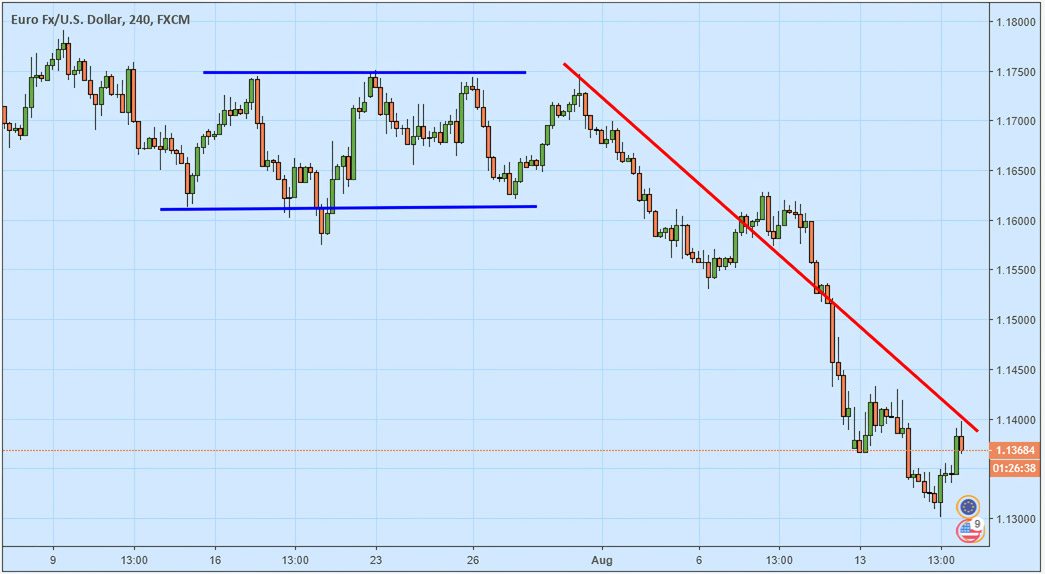
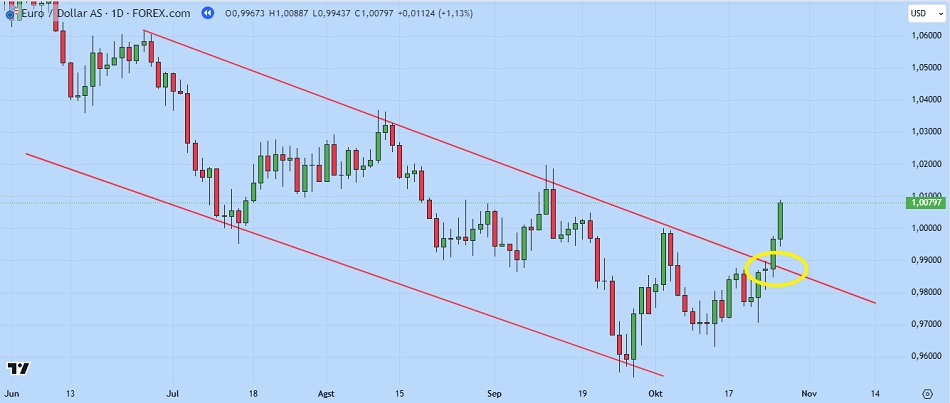
Based on the EUR/USD chart mentioned earlier, two types of trends can be identified: sideways and bearish. The sideways movement is contained within the blue lines, while the bearish trend is indicated by a series of lower highs, marked by the red trendline.
Traders can also draw overlapping trendlines. For instance, in the USD/CHF chart below:
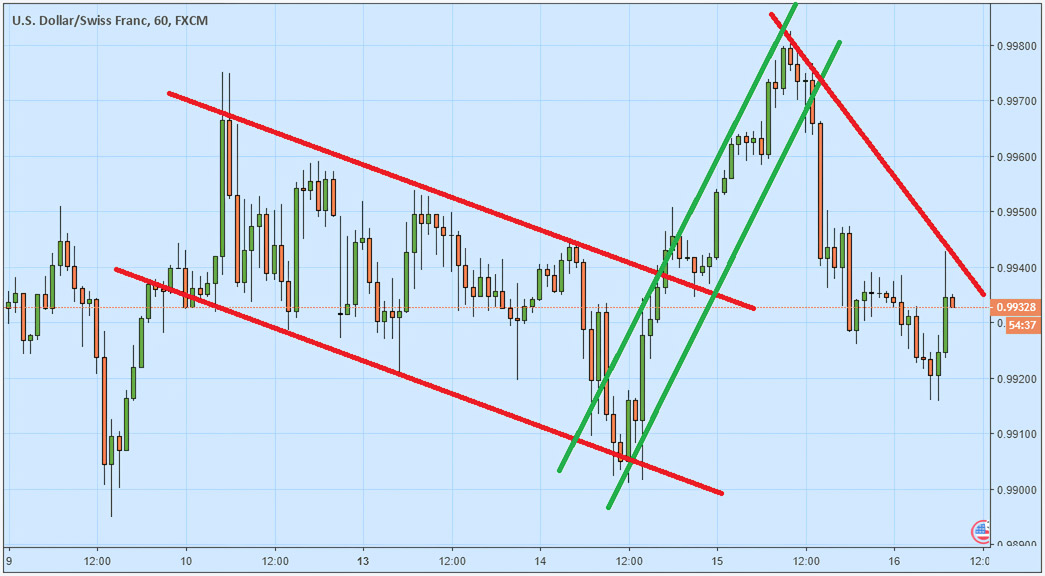
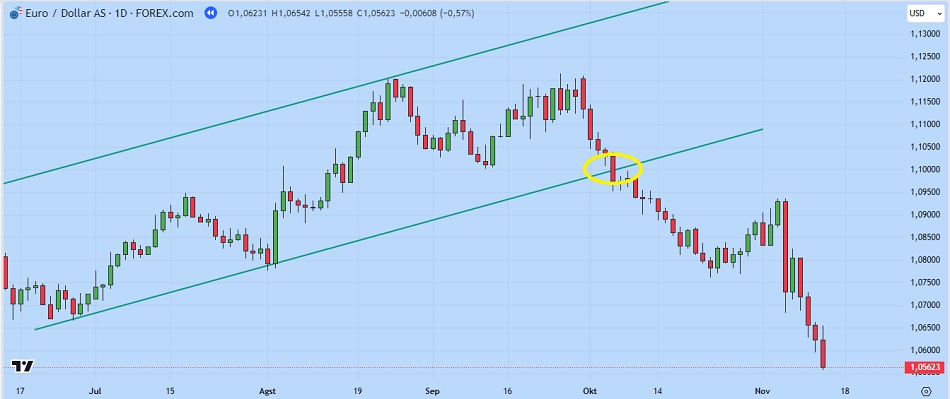
The price initially moves in a bearish trend, as shown by the red trendline. After breaking above this line, the market turns bullish for a period, indicated by the green trendline, before falling again. As USD/CHF moves around the 0.9932 level and forms a new resistance, another red trendline can be drawn to highlight the renewed bearish condition.
Step 3: Using Trendlines in Forex Trading
Once the trendlines have been drawn, they can be used as practical tools for forex trading. Traders typically rely on trendlines to identify bounce and breakout opportunities, based on the following principles:
- When the price bounces off the upper trendline, it suggests that the price may decline toward the lower trendline.
- When the price bounces off the lower trendline, it suggests that the price may rise toward the upper trendline.
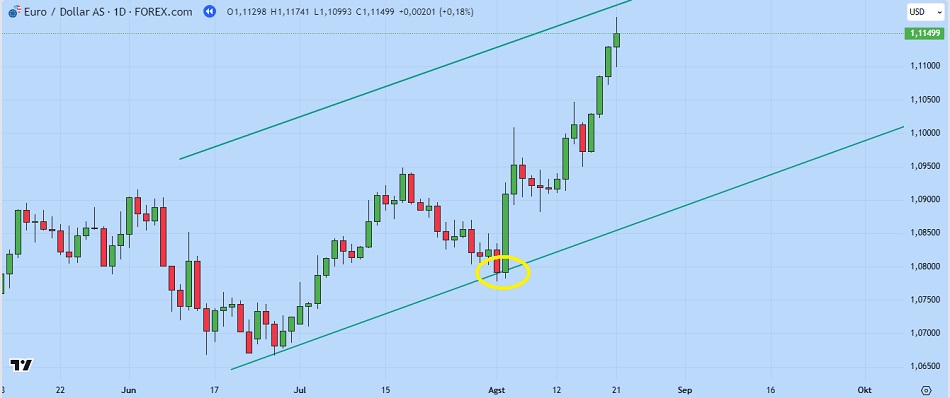
- If, during a bearish trend, the price breaks above the upper trendline, it may signal the beginning of a bullish trend.
- If, during a bullish trend, the price breaks below the lower trendline, it may signal the beginning of a bearish trend.
To strengthen bounce and breakout signals, traders can combine trendline analysis with other technical indicators or observe candlestick patterns that form near the bounce or breakout areas.