ADX in Technical Analysis: Identifying Strong and Weak Trends
Sometimes, only following the trend is not enough. You need to analyze the strength of the trend for more confirmations before entering the market. The ADX indicator is built for that exact purpose.
Trend-following strategies remain among the most widely used and potentially profitable approaches in financial markets. Most trading platforms already provide multiple indicators designed to identify trend direction, and various proprietary tools aimed at measuring trend direction and strength are also widely available. However, simplicity and reliability remain key considerations for many traders.
This article reviews the application of a relatively simple yet widely used trend-strength indicator—the Average Directional Index, or ADX. Although the ADX is often categorized as a lagging indicator due to its slower response to price movements, it remains a dependable and effective tool once traders become familiar with its behavior and interpretation.
ADX Indicator at a Glance
The ADX indicator was developed by Welles Wilder specifically to measure the strength and direction of market trends. In principle, the indicator is designed to signal when a trend begins, how strong that trend is, and when it starts to weaken. When trading with ADX, the general guideline is to enter positions as a trend gains strength and exit when momentum begins to fade.
There is no specific time frame that is universally best for ADX. In practice, the indicator can be applied effectively across all trading timeframes. While the mathematical formulation behind ADX is relatively complex, its practical application is straightforward and does not require frequent parameter adjustments when switching between timeframes. On the widely used MetaTrader platform, the indicator can be applied directly via Insert – Indicators – Average Directional Movement Index.
The Basics of ADX Indicator
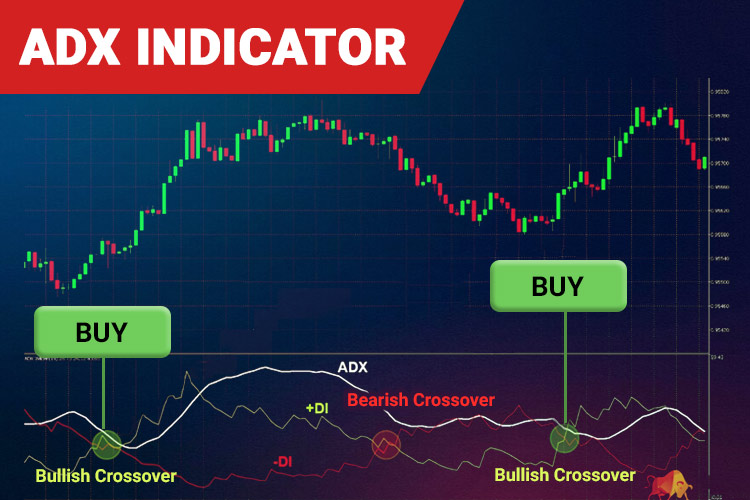
The ADX indicator consists of three main components:
- The ADX line itself measures trend strength. As a general guideline, an ADX reading above 20 suggests that a trend is gaining momentum. An ADX level between 20 and 40 indicates a strong trend, while readings between 40 and 60 often correspond to overbought or oversold conditions. An ADX value above 60 suggests that the trend may be approaching exhaustion and could be vulnerable to a reversal. When the ADX line is rising, trend strength is increasing regardless of whether the market is trending upward or downward. Conversely, a declining ADX line signals weakening momentum in both trends. The most commonly used setting for ADX is 14.
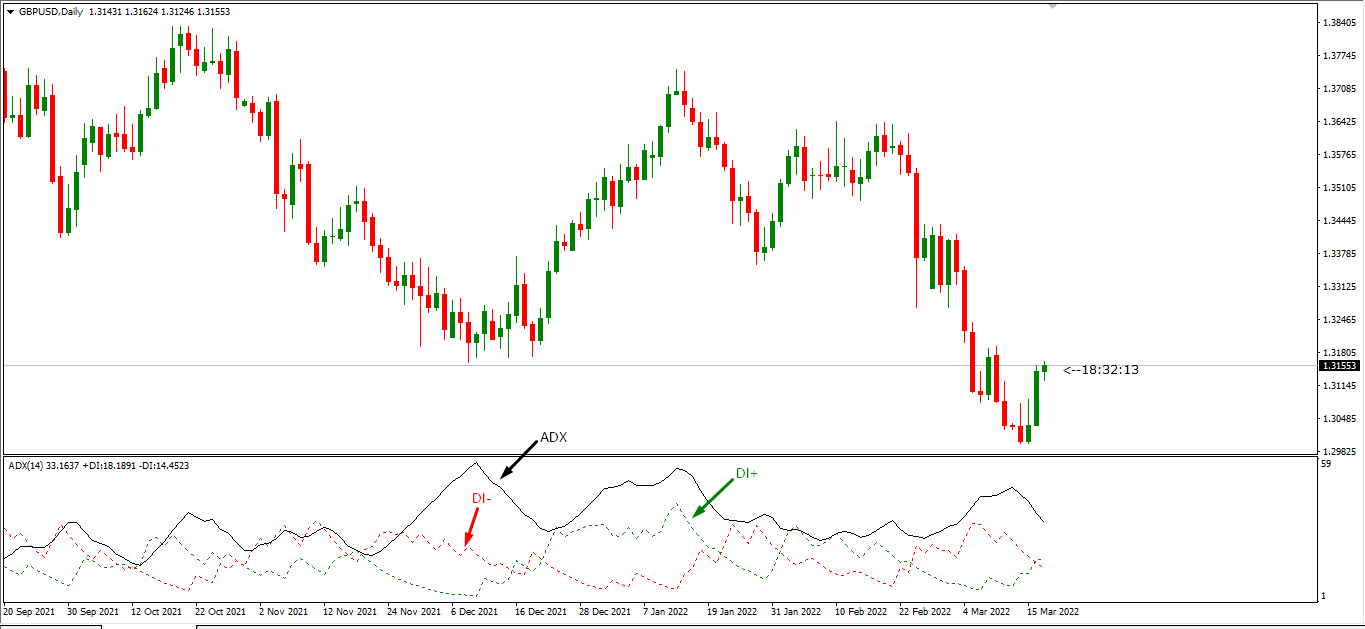
- +DI (Positive Directional Index). Typically displayed in green, it represents upward directional movement. The +DI line rises during an uptrend and declines during a downtrend.
- -DI (Negative Directional Index). Usually shown in red, it represents downward directional movement. The -DI line rises during a downtrend and falls during an uptrend.
When the +DI and -DI lines intersect, it signals a potential change in trend direction. Specifically:
- If +DI crosses above -DI from below, it indicates the potential start of an uptrend.
- If -DI crosses above +DI from below, it indicates the potential start of a downtrend.
Trading with the ADX Indicator
The trading rules associated with the ADX indicator are relatively straightforward, making it accessible to both novice and experienced traders.
Trade entries should be considered only when the following conditions are met:
- A crossover occurs between the +DI and -DI lines.
- The ADX level is above 20 and moving upward.
- If a +DI and -DI crossover occurs while the ADX line is declining, the trend is considered weak, and entering a trade is not recommended.
Trade exits are generally triggered when the trend begins to weaken, as indicated by the ADX line turning downward.
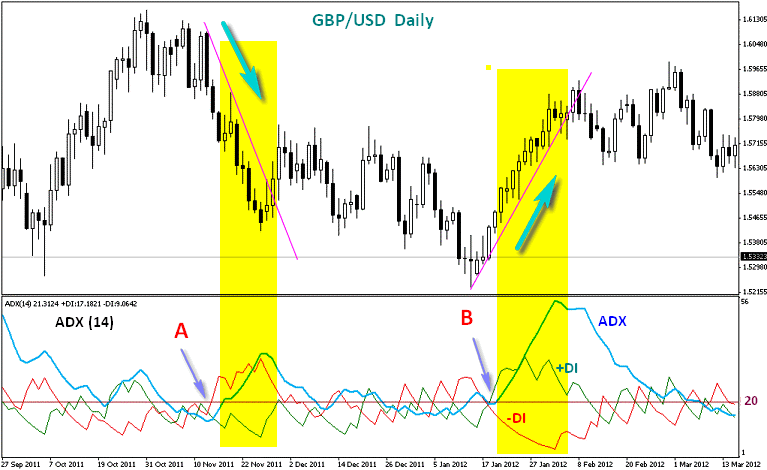
Refer to points A and B in the image above:
- At point A, the -DI line crosses above the +DI line from below, signaling the potential start of a downtrend. A sell position may be entered once the ADX line begins rising and moves above the 20 level (highlighted in the yellow area).
- At point B, the +DI line crosses above the -DI line from below, signaling the potential start of an uptrend. A buy position may be entered once the ADX line is rising and remains above the 20 level (yellow area).
- Positions are closed when the ADX line starts to move downward, marking the end of the yellow-highlighted zone.
Trading Tips Using the ADX Indicator
Below are several trading tips that can help traders maximize the effectiveness of the ADX indicator:
- Use ADX to Measure Trend Strength
The Average Directional Index is a powerful tool for assessing market trend strength and is widely used to identify trading opportunities in trending environments. One of its key advantages is its ability to distinguish between strong trends (ADX above 25) and weak or ranging markets (ADX below 20). However, since ADX does not indicate trend direction, it is most effective when combined with directional tools such as Moving Averages, or with indicators like Bollinger Bands and MACD to confirm momentum and volatility. - Pay Attention to Crossovers
Crossovers between the +DI and -DI lines provide important directional signals. A buy signal is typically generated when +DI crosses above -DI, particularly when the ADX line confirms strengthening momentum. A sharp rise in ADX from low levels—such as an increase from 15 to 25—often serves as an early indication of a new trend forming. Traders should remain cautious when applying ADX in sideways markets, where signals tend to be less reliable. - Never Overlook Divergence and Period Settings
To enhance signal accuracy, traders may analyze divergence between price action and the ADX indicator or adjust the indicator's period settings. Shorter periods (5–9) can be used to capture faster signals, while longer periods (20–50) are more suitable for identifying long-term trends. - Establish Strict Risk Management and Keep Practicing
Effective risk management remains essential. Stop-loss levels should be set based on key trend structures, such as previous swing highs or lows, to limit downside risk. With consistent practice, disciplined backtesting, and proper risk control, the ADX indicator can evolve into a powerful component of a trader’s overall strategy, helping to capture significant opportunities in dynamic market conditions.
From the explanations above, it can be concluded that the ADX indicator is well-suited for strategies that rely on trending conditions, whether trend-following or trend-reversal approaches. However, due to the relative complexity of its interpretation, ADX may not be ideal for beginners. Traders new to ADX are encouraged to first practice applying it in a demo account before incorporating it into live trading.