MACD Indicator Explained for Forex Traders
Trading with the MACD (Moving Average Convergence/Divergence) indicator is considered very easy and simple for retail and professional traders alike. Let's explore all you need to know about the MACD and how to use it in forex trading.
In the foreign exchange market, traders are confronted with a wide array of technical indicators designed to assist in identifying entry and exit points. The sheer volume of available tools can be overwhelming for novice participants. Among these, however, the MACD stands out as one of the most widely adopted indicators, valued for its clarity and versatility.
The MACD gained prominence shortly after its introduction by Gerald Appel in 1979. Its appeal lies in simplicity and adaptability, attributes that quickly earned it recognition across trading communities. Over time, the indicator has become a staple in technical analysis, frequently cited as a reliable tool for gauging market dynamics.
Generally, the MACD indicator is used to:
- Measure the strength of the ongoing trend.
- Identify optimal entry and exit levels.
- Measure the underlying market momentum.
- Identify overbought or oversold.
For many forex traders, the MACD remains one of the most trusted technical instruments. Its multifunctional nature allows it to be integrated into a variety of trading strategies, making it a cornerstone of technical analysis.
MACD Indicator Components
The MACD is constructed using two Exponential Moving Averages (EMAs): a 12-period EMA (fast length) and a 26-period EMA (slow length). On price charts, the shorter EMA provides more granular detail compared to the longer one. The divergence between these two lines is visually represented in the histogram, where the spacing reflects the degree of momentum. A wider gap corresponds to stronger momentum, while a narrower gap signals weakening conditions.
Key interpretations include:
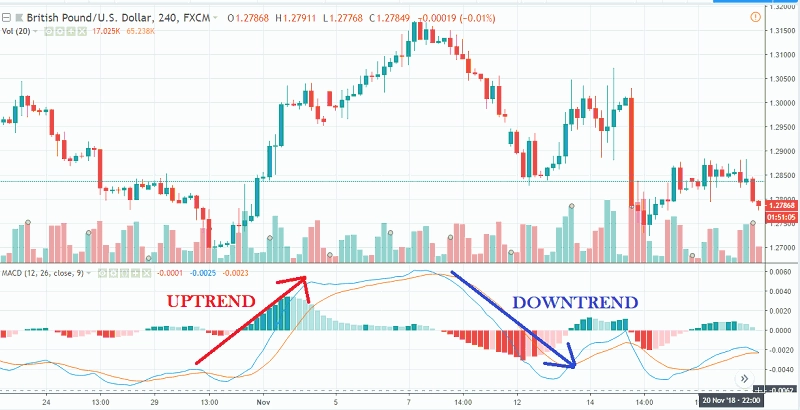
- When EMA-12 is above EMA-26, the MACD value is positive, and the histogram is above the zero line; they signal an uptrend.
- When EMA-12 falls below EMA-26, the MACD value turns negative, and the histogram falls below zero; they indicat a downtrend.
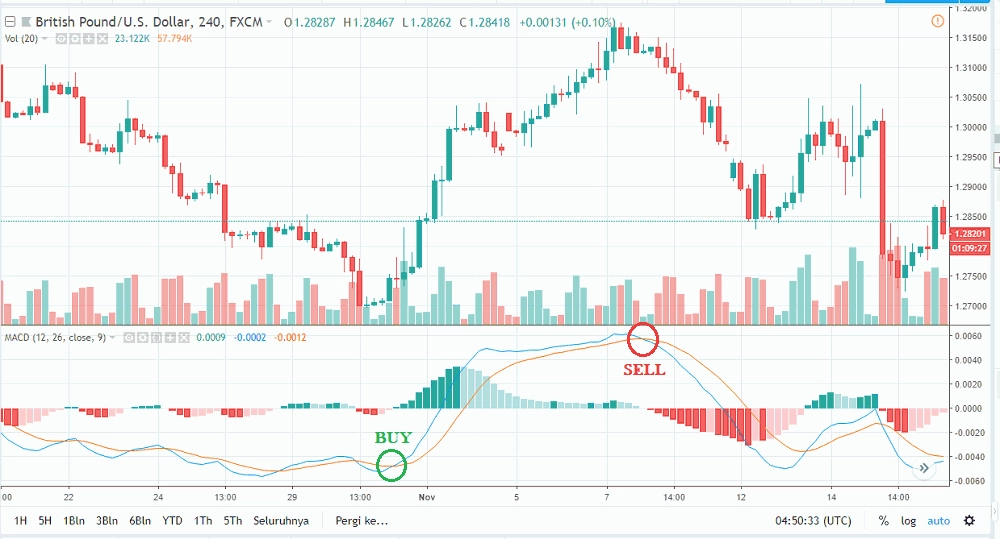
- A bullish crossover occurs when EMA-12 crosses above EMA-26, often interpreted as a buy signal.
- Conversely, a bearish crossover occurs when EMA-26 crosses above EMA-12, typically viewed as a sell signal.
How to Read the MACD Indicator
Given its multifunctional design, the MACD can be interpreted in several ways depending on the trader’s objective. Below are the primary applications:
1. As a Trend Indicator
The MACD’s core utility lies in identifying trend direction and momentum. When price action trends higher, the MACD histogram remains in positive territory above the zero line. Conversely, when price action trends lower, the histogram shifts into negative territory below zero.
2. As an Entry Indicator
Traders often combine MACD signals with EMA crossovers to refine entry timing. A buy position is typically confirmed when EMA-12 crosses EMA-26 from below to above. Conversely, a sell position is validated when EMA-26 crosses EMA-12 from above to below. This dual confirmation enhances the reliability of trade entries.
3. As a Momentum Gauge
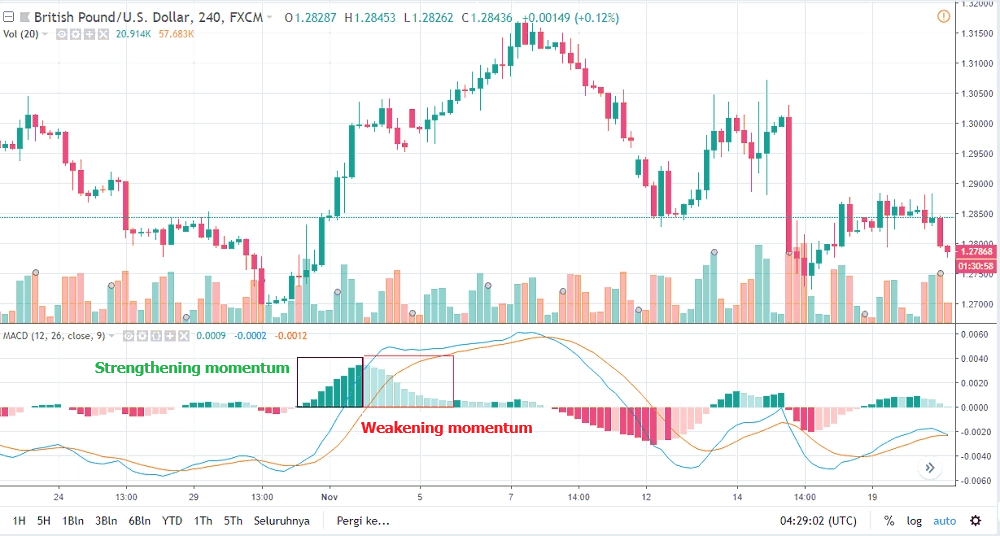
Beyond trend identification, the MACD is instrumental in gauging market momentum. Histogram bars provide a visual measure of strength:
- At the onset of a new trend, histogram bars are short but gradually extend as momentum builds.
- The peak of momentum is marked by the longest histogram bar, reflecting maximum market strength.
- A weakening trend is signaled when histogram bars begin to shorten, suggesting fading momentum.
- As the market transitions, the histogram flattens and contracts, eventually repeating the cycle in the opposite direction.
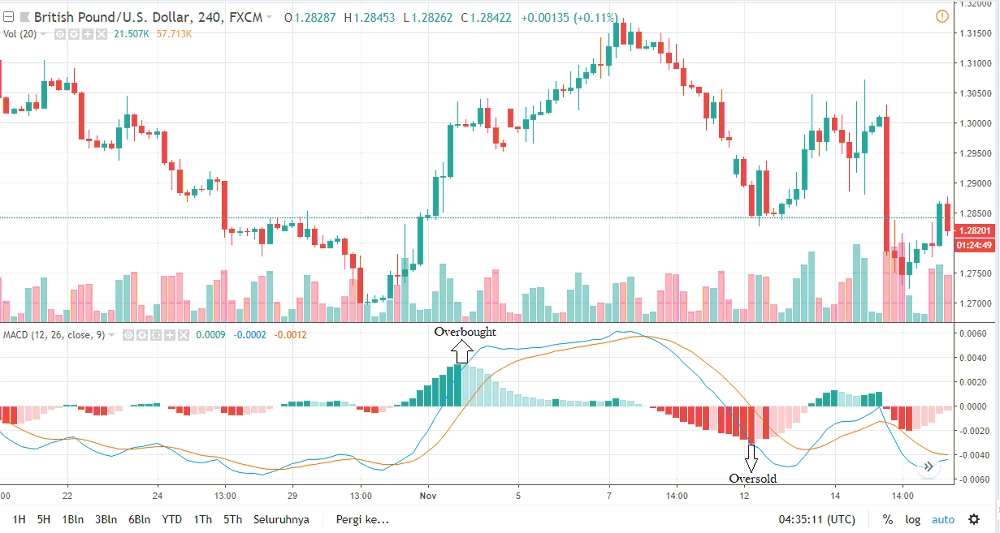
4. As an Oscillator
Closely tied to its momentum function, the MACD also serves as an oscillator to identify overbought and oversold conditions. Traders typically interpret peaks in the positive histogram as overbought signals, while peaks in the negative histogram are viewed as oversold signals. These readings can provide early warnings of potential reversals.
Final Thoughts
For experienced traders seeking to optimize profitability, the MACD can be further enhanced by combining it with complementary indicators or alternative analytical frameworks. This layered approach often yields more robust and confirmed signals, strengthening overall trading performance.