The Simple Guide to ichimoku Kinko Hyo
Understand the Ichimoku Kinko Hyo indicator and learn how traders use it to spot trends, confirm momentum, and set buy, sell, and stop levels.
Do you have difficulty adjusting the settings of several technical indicators every time you trade? Many traders use two or more indicators to accurately determine buy or sell levels, stop losses, and take profits. Well we can actually use just one single indicator to identify those levels, which is the Ichimoku Kinko Hyo indicator.
Getting to Know the Ichimoku Indicator
The Ichimoku Kinko Hyo indicator—commonly referred to simply as Ichimoku—is widely regarded for its accuracy in identifying trend direction as well as key support and resistance levels. As a result, Ichimoku is often considered a reliable and relatively easy-to-use tool for determining buy and sell signals, along with stop-loss reference levels, particularly in the forex market.
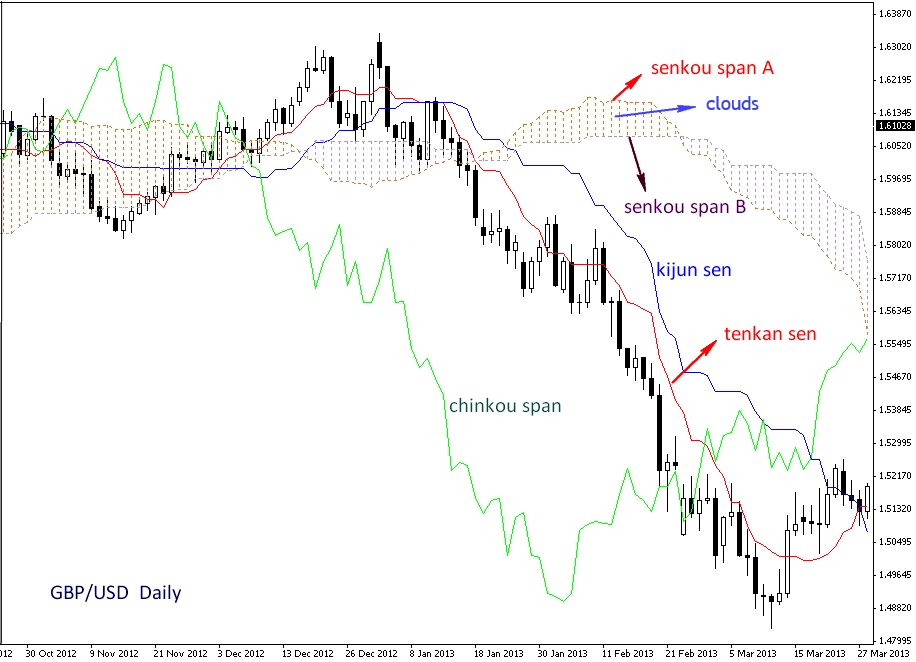
Day traders use this indicator across timeframes ranging from the Daily chart down to the 1-hour (H1) timeframe. However, Ichimoku generally delivers more reliable signals when applied to higher timeframes such as the Daily and Weekly charts. Below is an illustration of the Ichimoku indicator applied to the GBP/USD pair on the Daily timeframe:
Originally developed by Japanese analyst Goichi Hosoda in the 1930s, the Ichimoku Kinko Hyo is fundamentally a trend-identification system derived from moving average calculations. Unlike standard moving averages, however, Ichimoku incorporates a broader data set, making it more responsive to overall market balance rather than relying solely on closing prices.
The primary distinction between Ichimoku and conventional moving averages lies in the use of the midpoint—50 percent of the highest high and lowest low of each candle—to plot its lines. This approach allows the indicator to better reflect price equilibrium. Below are the definitions and functions of each Ichimoku component:
Tenkan Sen
(Highest high level + Lowest low level) / 2 over the last 9 periods.
The Tenkan Sen functions as a minor support or resistance level and is commonly used to gauge short-term trend direction. When the Tenkan Sen slopes downward, market conditions are considered bearish. When it slopes upward, conditions are bullish. In sideways or range-bound markets, the Tenkan Sen typically moves in a flat, horizontal manner.
Kijun Sen
(Highest high level + Lowest low level) / 2 over the last 26 periods.
The Kijun Sen is primarily used to confirm overall trend direction and serves as a more significant support or resistance level. It is also frequently used as a reference point for setting trailing stop levels.
The interaction between the Tenkan Sen and Kijun Sen resembles the crossover technique commonly applied using two moving averages. If the Kijun Sen is positioned above the Tenkan Sen during a downtrend, bearish momentum is likely to persist. Conversely, if the Kijun Sen is positioned below the Tenkan Sen during an uptrend, bullish momentum is likely to continue.
Senkou Span
- Senkou Span A: (Tenkan Sen + Kijun Sen) / 2, projected forward by 26 periods.
- Senkou Span B: (highest high + lowest low) / 2 over the last 52 periods, projected forward by 26 periods.
The area between Senkou Span A and Senkou Span B forms what is known as the cloud, or kumo. This cloud is the most critical element of the Ichimoku system, as it defines dynamic support and resistance zones.
When price trades above the cloud, the upper Senkou Span acts as the first support level, while the lower Senkou Span serves as the second support. Conversely, when price trades below the cloud, the lower Senkou Span becomes the first resistance level, and the upper Senkou Span functions as the second resistance.
If price action remains within the cloud, market conditions are considered range-bound or sideways. The thickness of the cloud varies depending on price volatility, with a thicker cloud indicating higher volatility and stronger support or resistance.
Chikou Span
The closing price plotted 26 periods backward.
The Chikou Span, displayed as a green line, is primarily used as a confirmation tool for entry signals. If the Chikou Span crosses price from above to below, it generates a sell signal. Conversely, if it crosses price from below to above, it signals a potential buy opportunity.
Things to Note
Given the comprehensive nature of the Ichimoku Kinko Hyo system, traders often do not rely on additional indicators when using it. Buy and sell opportunities can be identified through the interaction between the Tenkan Sen and Kijun Sen, while the strength and direction of price momentum—bullish or bearish—can be confirmed using the Chikou Span.
In summary, the following key considerations should be taken into account when applying the Ichimoku indicator:
- The crossover between Kijun Sen and Tenkan Sen. The crossover between these two lines functions similarly to a traditional moving average crossover strategy. When the Tenkan Sen (red) crosses below the Kijun Sen (blue), it signals a potential sell opportunity. Conversely, when the Tenkan Sen crosses above the Kijun Sen, it indicates a potential buy signal.
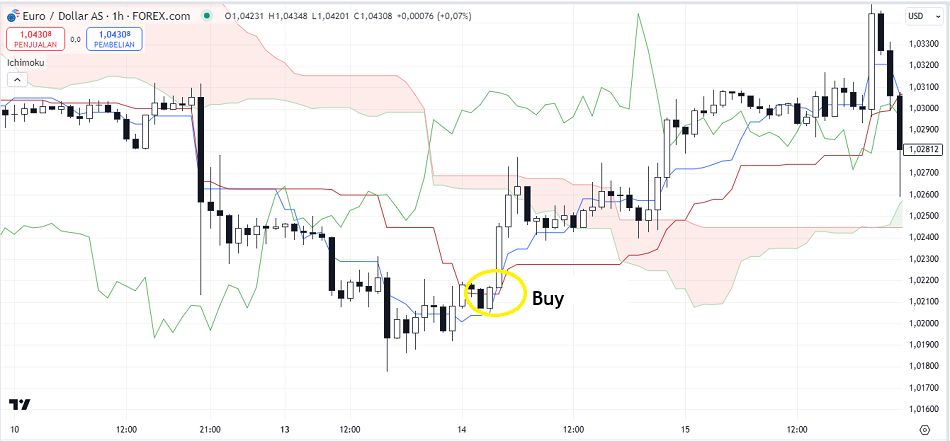
- Confirm market sentiment with Chikou Span. The Chikou Span (green line) is used to validate bullish or bearish sentiment. If the Chikou Span is trending downward, market sentiment is considered bearish. Conversely, an upward-moving Chikou Span reflects bullish sentiment.
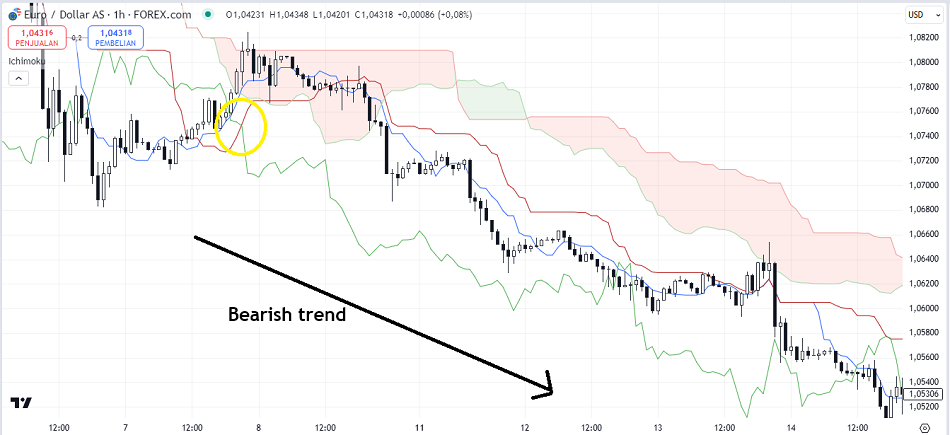
- Price movement trends need to break the cloud, either moving up (for an uptrend) or down (for a downtrend). A valid trending move typically requires the price to break decisively above the cloud in an uptrend or below the cloud in a downtrend. The probability of a sustained rally or decline is significantly higher once the price has exited the cloud, compared with periods when the price remains trapped within.
- Set stop loss levels at Tenkan Sen or Kijun Sen as the next support or resistance levels. You should also apply sound and proportional money management principles to control risk effectively.